Lab 05
In lab 5, I worked with Marco van Germenen to develop and execute a vulnerability analysis using our skills in SQL and data from Open Street Map. The goal of this lab was to design and preform a vulnerability analysis which would be accessible and replicable to the public. We chose Dar es Salaam as our focus region since the city is one of the most mapped locations on Open Street Map with special thanks to the Tanzania Resilience Academy.
For our vulnerability analysis, Marco and I chose to calculate the number of schools per ward in Dar es Salaam in hopes to understand how educational resources are distributed around the city. Wards with a lower number of schools may indicate areas with less access to resources, an indicator of vulnerabilty. Wards with a higher number of schools may indicate neighborhoods with more access to resources. This exercise is a spatial analysis since we aim to find out the distribution of schools in relation to the administrative subwards across our defined space in hopes to understand a pattern or trend.
The concept of counting the number of schools per ward seems simple, but ran into some unexpected problems. Therefore, I have outlined our process below. Our final leaflet map is attached here.
Our data from this lab was downloaded from Tanzania Resilience Academy and Open Street Map.
Data Download
– Download data from open street map into QGIS – We used these [files] written by our professor, Joe Holler, and proceeded to preform the following steps:
- Download Open Street Map data by going to open street map and zooming to the desired extent. Click “Overpass API” and save the file as a “.osm” file.
- Open the convertOSM.bat in Notepad++ and change the database name to your database and the username to your username. Save.
- Open dsm.style in Notepad++ and edit for the desired tags.
- Run the convertOSM.bat and the data will download into the PostGIS database!
– Download data from Tanzania Resilience Academy into QGIS –
- We first added a WFT feature layer in QGIS
- Choose a logical name and insert this url: https://geonode.resilienceacademy.ac.tz/geoserver/ows. Hit ok.
- Add the “Dar es Salaam Administrative Sub-wards” layer to QGIS
- Open DB Manager and connect to your database
- Import the “Dar es Salaam Administrative Sub-wards” layer
After downloading our data, we are reading to use SQL to execute our research question. Download our complete and annotated SQL code here.
Step 1
We selected for the data that we wanted to use in our analysis. Seeing as we wanted to look at number of schools per ward, we used the SELECT tool WHERE amenity = ‘school’. We added, “CREATE VIEW,” so we could have a visualize of the data.
Now we run into a little issue here… we have points that represent schools, and polygons that represent schools, and some points represent the same polygons. We will need to find a way to make a layer of points in which every school is represented by one point.
Step 2
We used the below query to find all the points (representing schools) which intersected with polygons:
"ALTER TABLE planet_osm_polygon ADD COLUMN intersectsPoint Interger
UPDATE planet_osm_polygon
SET intersectsPoint = 1
FROM planet_osm_point
WHERE amenity = 'school'AND st_intersect(planet_osm_polygon.way, planet_osm_point.way)
Followed by:
SELECT * FROM planet_osm_polygon WHERE intersectsPoint = 1
Step 3
We have selected all the points that intersect with a polygon. We now want to take the remaining polygons, which don’t intersect with points, and transform the polygons into points (in other words, find the centroid) and reproject the data into the proper coordinate system.
Here’s the query:
  SELECT osm_id, name, amenity, st_centroid(st_transform(way, 32727)), intersectsPoint
  FROM planet_osm_polygon
  WHERE amenity = 'school' and intersectpoint is NULL
Step 4
We now need to join the centroid (representing schools that didn’t intersect with points) with the points (representing schools that intersected with polygons). It’s important to note that we used the UNION function in this query because we wanted to add rows to rows, not match columns.
CREATE TABLE mergedSchools AS
SELECT osm_id, amenity, st_centroid FROM pointlessSchools2
UNION
SELECT osm_id, amenity, st_transform(way, 32727) FROM planet_osm_point
WHERE amenity = 'school'
Step 5
At this point in the query, we identified another issue – some of the schools have duplicate names! In order to deal with these duplicate, we want to group by “name.” However, some of the schools have blank names, so when we use group by, all the schools with blank names are grouped together (one group with over 100 schools representing blank names is not what we want). So, we are filtering out the blank names before we use the group by function. We then add the blank names back into the non-blank names after we have removed the duplicates.
CREATE TABLE nonBlank_Schools AS
SELECT * FROM mergedSchools
WHERE name <>""
Step 6
After we removed the blank names, we removed the duplicates by grouping by name and then finding the centroid of the union of the duplicates (looking at the geometry of the duplicate schools and then finding the center point between them).
CREATE TABLE groupedSchools AS
SELECT st_centroid(st_union(st_centroid)), trim(upper(name)) FROM nonBlank_Schools
GROUP BY trim(upper(name))
In this situation, it was really important to add “trim” and “upper” to the function in both parts of the query so the computer would still count schools as duplicates even if the names had difference capital letters and/or spacing.
Step 7
Now, we need to UNION the blank schools back into the grouped schools table.
CREATE TABLE remergedSchools AS
SELECT btrim AS name, st_centroid as geom FROM groupedSchools
UNION
SELECT name, st_centroid as geom FROM blankschools
In the above query, we need to make sure we have the same number of columns in the two tables we are going to join. To make sure of this, we can specify the columns we want to join (“name”, “st_centroid”)
Step 8
We then need to count the number of schools within each ward. To do this, we first updated our remergedSchools data table and added the ward fid as a new column.
UPDATE remergedSchools
SET ward = subwards.fid
FROM subwards
WHERE st_intersects(remergedSchools.geom, st_transform(subwards.geom, 32727))
Step 9
Now we want to count up the schools in each ward:
CREATE TABLE schoolWard as
SELECT ward, count(*) as schoolCount FROM remergedSchools
GROUP BY ward
Since we couldn’t carry over the geometry while using the “GROUP BY” function, we needed to join the geometry data to the table we just made, making sure to add a new column before we do so. After we made the new column, we added the geometry data to the schoolWard table, and then used “COUNT” to count the number of schools within each SchoolWard.
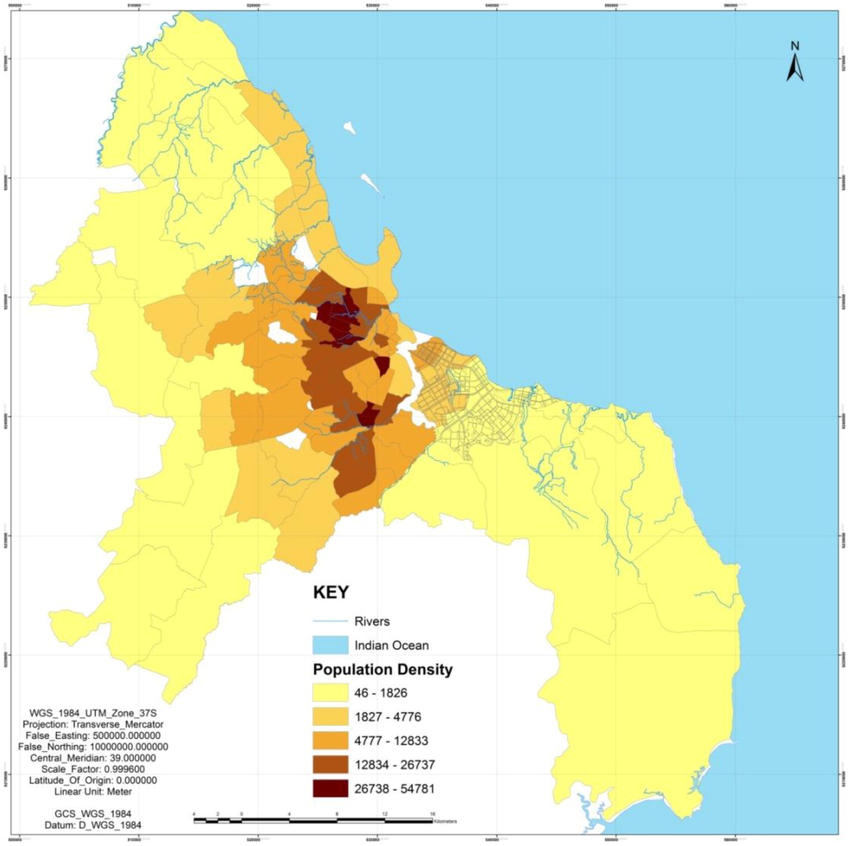
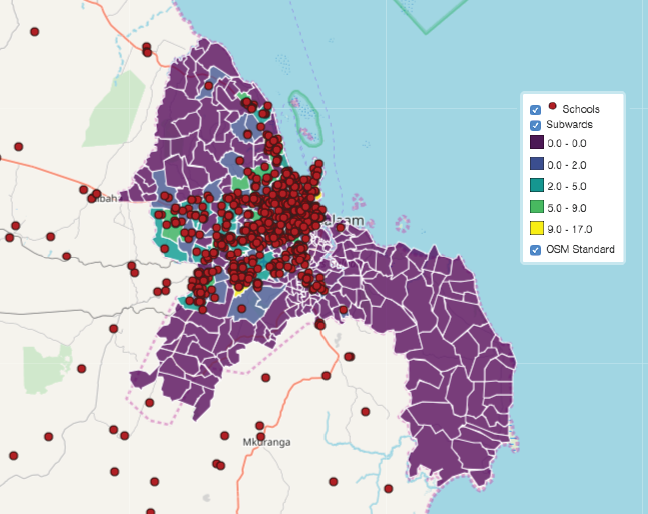
After this final step in our SQL query, we then presented our findings as a leaflet file. In the interactive version of the map, you are able to see number of schools per ward and total population per ward. For reference, I’ve attached a map from Research Gate showing the population density in Dar es Salaam. Below is a screen shot of our final map:
Conclusion and Discussion
The majority of schools are largely concentrated in the center of the city. The concentration of school intersects with the areas of Dar es Salaam with a high population density, which is an unsurprising phenomenon. As we move away from the city center, the number of schools decrease, which correlates with a population density decrease as well. However, in the far north, west, and south sections of Dar es Saalam, there are essentially none. This may indicate little access to educational resources, but also could be partially due to informal settlements and unreported school locations.
As a side note, it’s interesting that as we move away from the city center, school number per ward decreases. This phenomenom reminds me of the work we did in Lab 01 & Lab 02 looking at median gross rent in relation to the distance from the city center. Perhaps there is an opportunity here to use our model from Lab 01 & Lab 02 to understand how school number per ward changes in relation to distance from the city center.