Sarah Haedrich - GitHub Homepage
My name is Sarah Haedrich, and I’m currently a student at Middlebury College graduating in February of 2020. I’m majoring in environmental studies and geography. For my last geography class, I chose to learn about OpenSource GIS softwares in GEOG323 with Professor Joe Holler. Over the course of the semester, we worked with QGIS, R Studio, SAGA, and PostgreSQL among other softwares. This blog showcases my work in the course, broken down by lab exercises.
Article Review from Free and Open Source Software Conference 4G, 2019
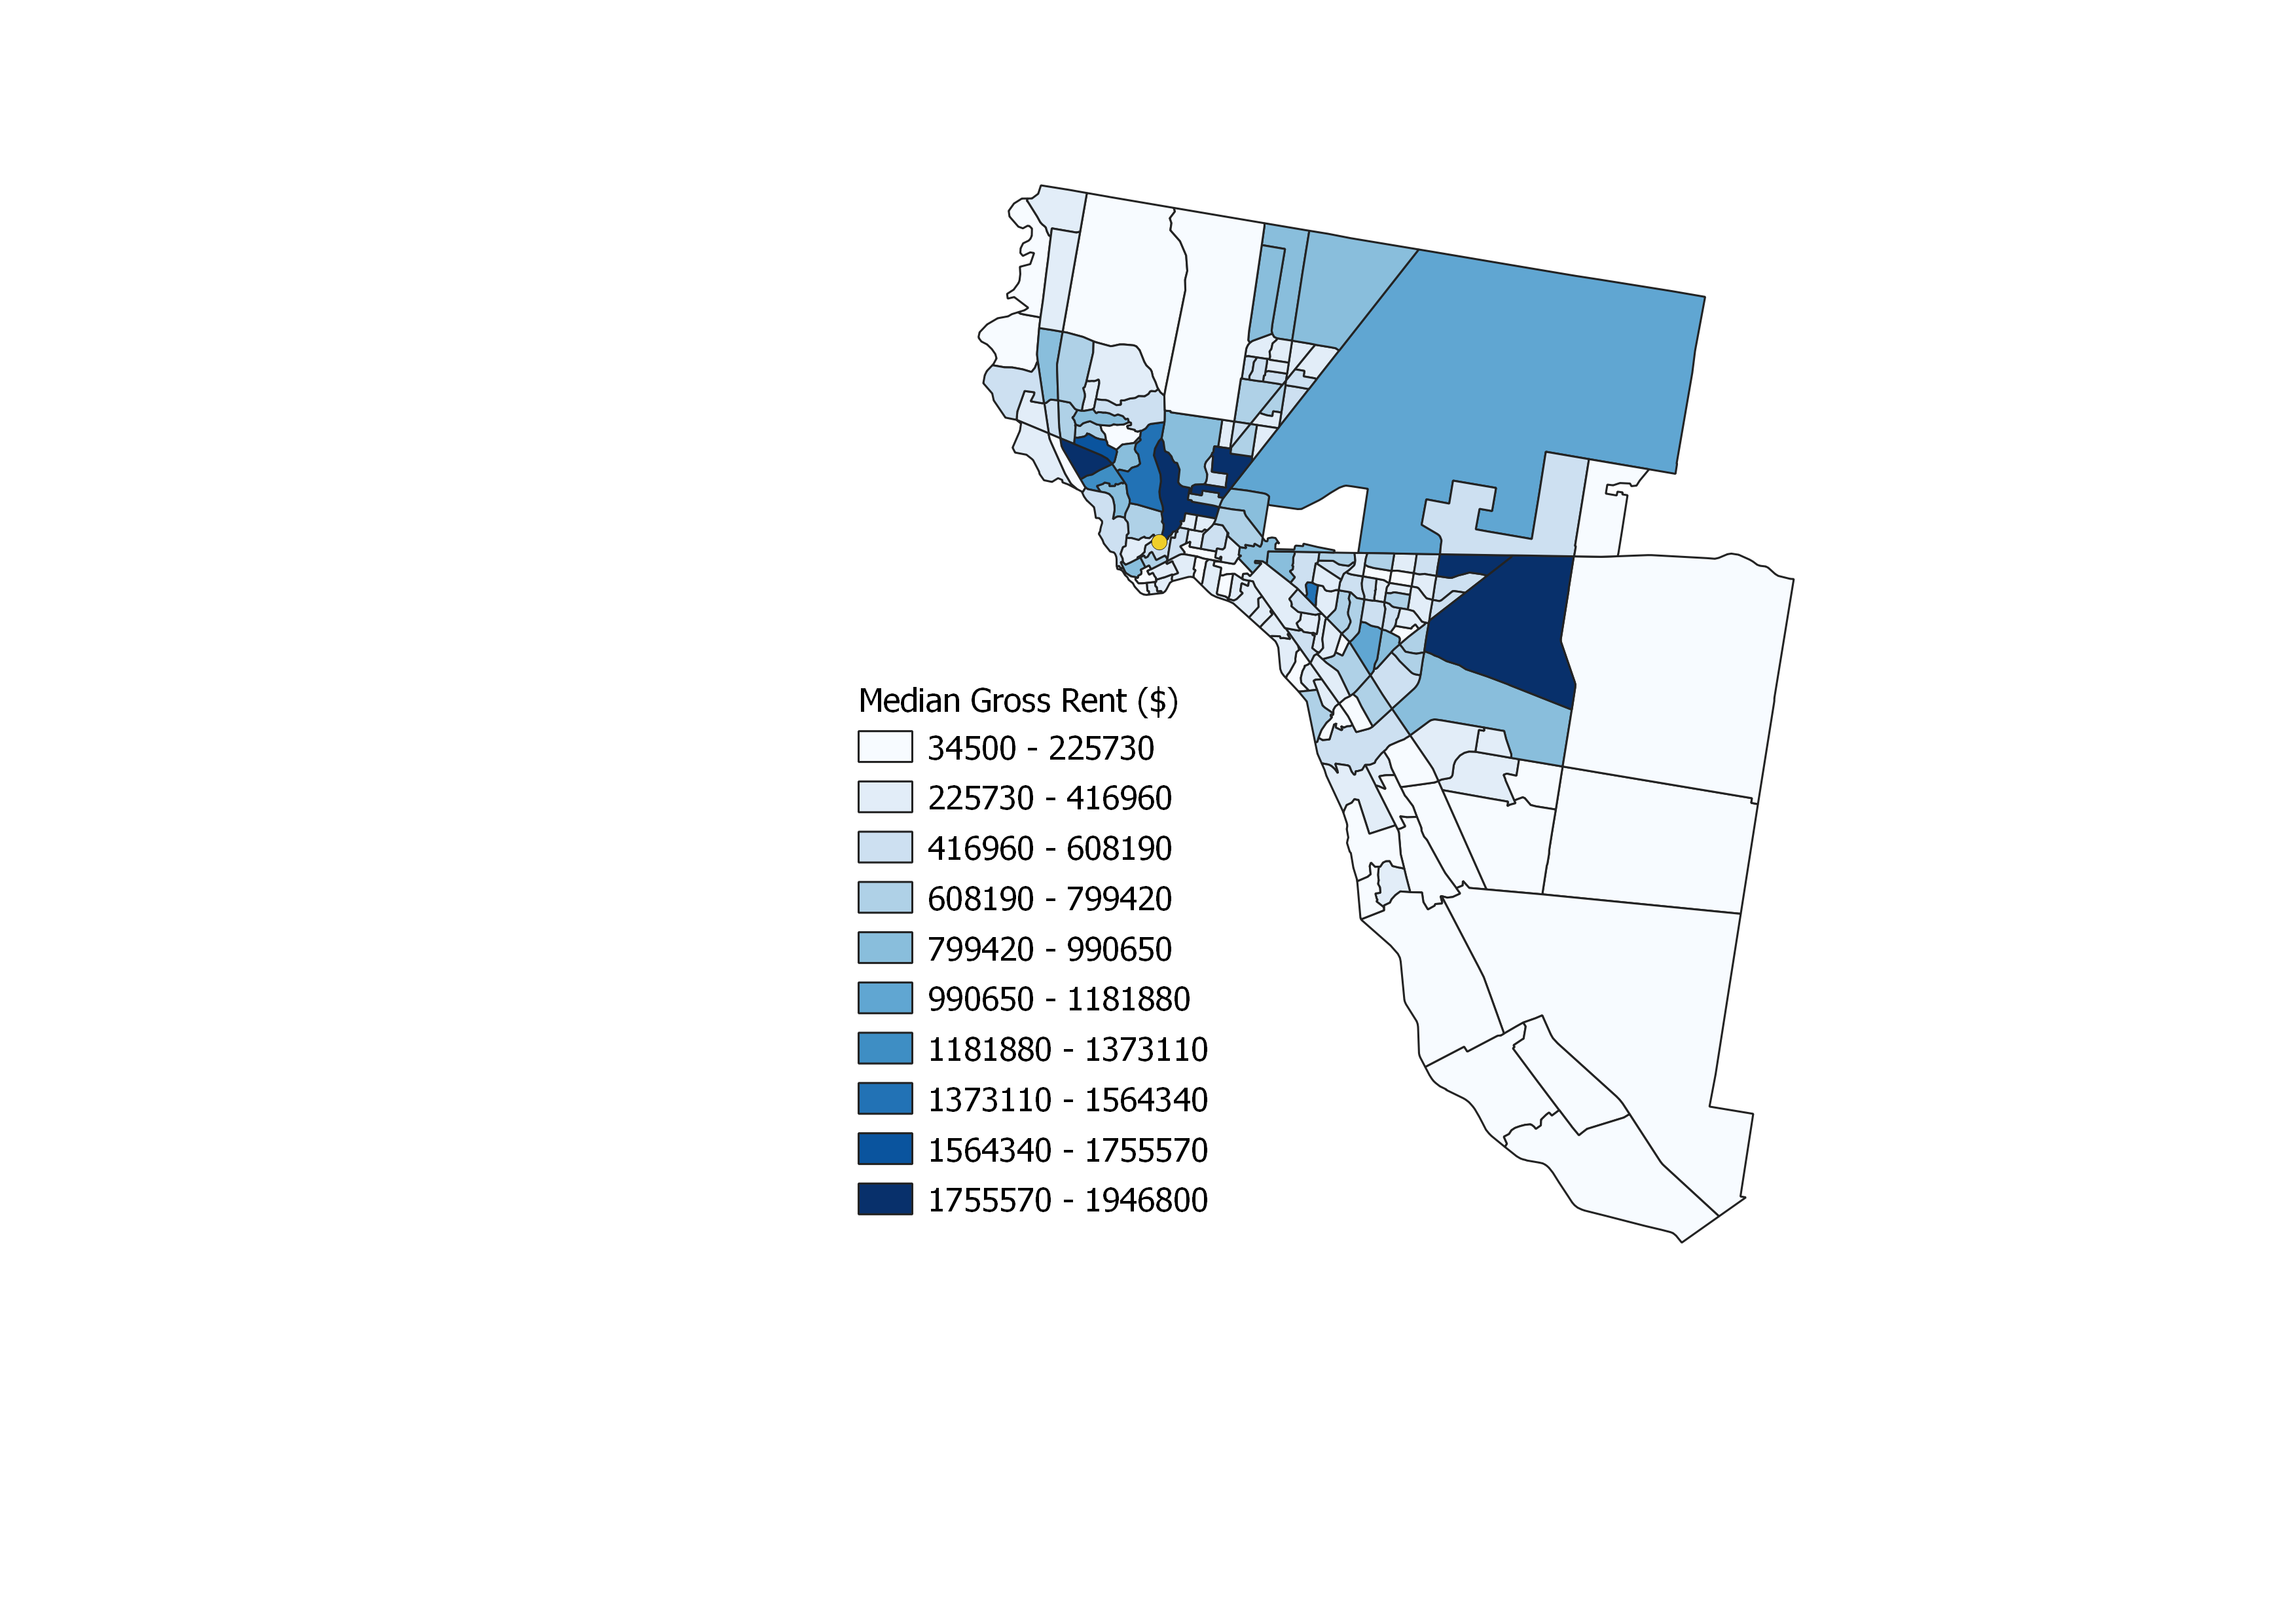
Lab 01 & Lab02: QGIS Direction and Distance Model In lab 2, we worked in QGIS to create a model to calculate the direction and distance from polygons to a point. I used the model I created to look at median gross rent in comparison to distance and direction in El Paso Texas.
Median Gross Rent by census tract in El Paso:
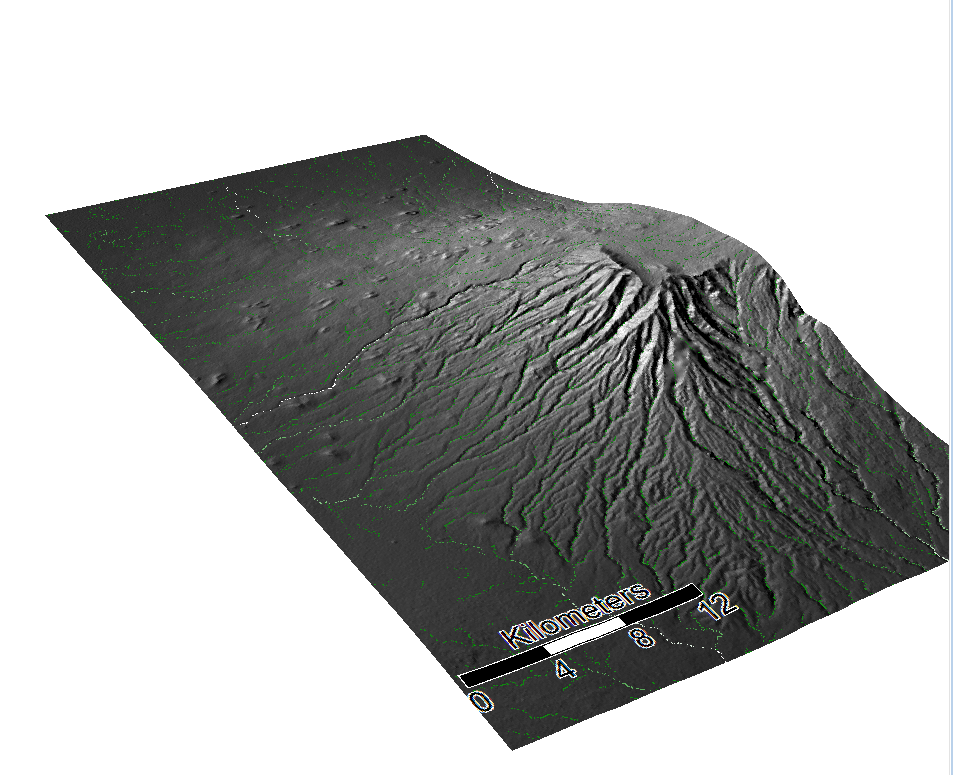
Lab 03: Hydrological Analysis of Mt. Kilimanjaro In lab 3, we worked in SAGA to create preform a hydrological analysis of Mt. Kilimanjaro using SRTM data from Earthdata Search. Our finished product is a channel network of the Mt. Kilimanjaro and the surrounding area.
Lab 04: Batch Scripts for Hydrological Analysis of Mt. Kilimanjaro In lab 4, we wrote batch scripts for the hydrological analysis we completed in lab 3 using both SRTM data and ASTER data downloaded from Earthdata Search. We also used error analysis
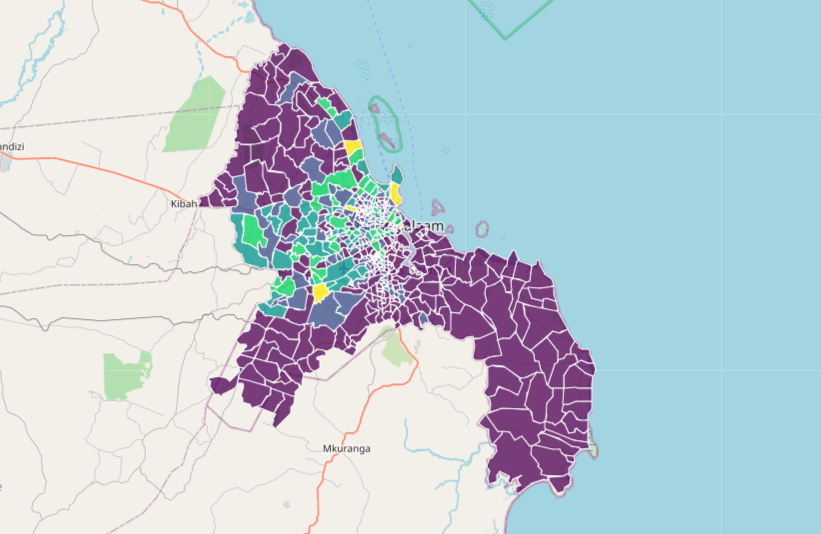
Lab 05 & Lab06: Vulnerability Analysis in Dar es Saalam In lab 5 and 6, we designed a vulnerability analysis in analyze Dar es Saalam, Tanzania. My partner and I decided to look at the number of schools per ward in Dar es Saalam using data from the Tanzania Resilience Academy.
Lab 07 & Lab08: Vulnerability Analysis in Malawi In Lab 07 & Lab 08, our class investigated at reproducibility and replicability by attempting to reproduce a vulnerability analysis in Malawi.
Lab09 & Lab10: Twitter Analysis in R Studio In Lab 09 & Lab 10, our class preformed a textual and spatial analysis of Twitter data during Hurricane Dorian across the Eastern United States.
Twitter activity concerning Hurricane Dorian
.PNG)
Twitter Article Review Discussing reproducibility and replicability in a study using Twitter data.
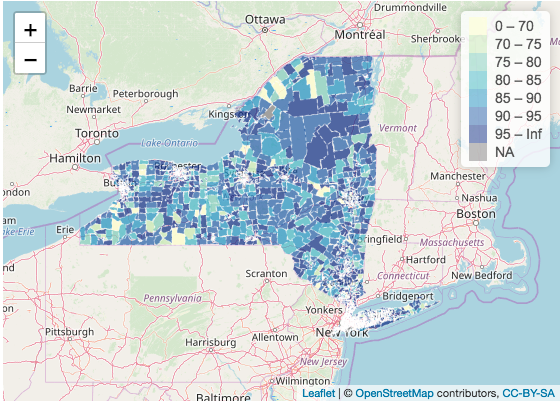
Final Project I looked at insurance coverage rates across New York state, with emphasis on New York City, relative to citizenship status, household income, and medical debt using R Studio.
Insurance coverage rate of households earning under 25,000k a year in New York state: